Multiple Choice
The population of a formerly endangered mouse is now on the rise. The population, N, over the last 8 years can be represented with the following graph: 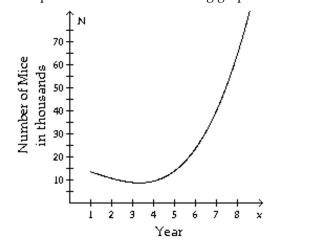 When was the mice population the lowest?
A) Just after the end of the third year.
B) At the beginning of the 8 year period.
C) Just before the end of the second year.
D) During the fifth year.
Correct Answer:

Verified
Correct Answer:
Verified
Q124: Explain what is wrong with the statement
Q273: Write the equation of the line
Q274: Write the slope-intercept form of the
Q275: Decide whether or not the set
Q276: (-7,3) and (2,3) <br>A)
Q278: Find the average rate of change
Q279: In 2012, a certain country recovered
Q280: <img src="https://d2lvgg3v3hfg70.cloudfront.net/TB6590/.jpg" alt="
Q281: Find the domain and range for
Q282: Determine if the graph represents a function.<br>-<img