Multiple Choice
Crafty Bill's Cool Car Sales opened as a used car sales lot in 2006. The graph shows the number of cars sold f as a function of time t. Find and interpret f(2010) . 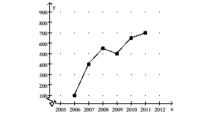
A) 450; Crafty Bill's Cool Car Sales sold 450 cars in 2010.
B) 600; Crafty Bill's Cool Car Sales sold 600 cars in 2010.
C) 600; Crafty Bill's Cool Car Sales sold 600 cars in 2006.
D) 650; Crafty Bill's Cool Car Sales sold 650 cars in 2010.
Correct Answer:

Verified
Correct Answer:
Verified
Q1: Suppose the cost of producing
Q2: Evaluate the function.<br>-Given <span class="ql-formula"
Q5: Write the equation of the line
Q6: State whether the graph is or is
Q7: State whether the graph is or is
Q8: Decide whether or not the set
Q9: Write the equation of the line
Q10: Use a graphing utility to graph
Q11: The percent p of high school
Q103: Write the word or phrase that best