Multiple Choice
The following graph shows data for a recent train ride from New York to Toronto. At what rate did the train travel? 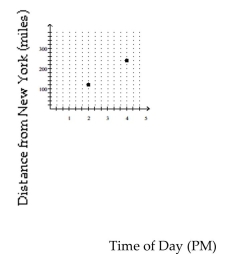
A) 60 miles per hour
B) 50 miles per hour
C) 120 miles per hour
D) 65 miles per hour
Correct Answer:

Verified
Correct Answer:
Verified
Related Questions
Q149: <img src="https://d2lvgg3v3hfg70.cloudfront.net/TB6590/.jpg" alt=" If
Q150: Determine whether the given relationship defines a
Q151: Decide whether or not the set
Q152: Decide whether or not the arrow diagram
Q153: Find the slope of the line
Q155: The table lists the monthly precipitation
Q156: In a certain town the annual
Q157: Find the slope of the line.<br>-<img
Q158: State whether the graph is or is
Q159: Write an equation of the line