Multiple Choice
Find the average rate of change illustrated in the graph. 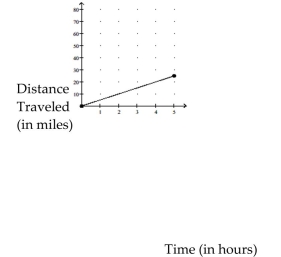
A) 2.5 miles per hour
B) 0.2 miles per hour
C) 25 miles per hour
D) 5 miles per hour
Correct Answer:

Verified
Correct Answer:
Verified
Q104: Write the word or phrase that best
Q295: <span class="ql-formula" data-value="y=-6-8 x"><span class="katex"><span class="katex-mathml"><math xmlns="http://www.w3.org/1998/Math/MathML"><semantics><mrow><mi>y</mi><mo>=</mo><mo>−</mo><mn>6</mn><mo>−</mo><mn>8</mn><mi>x</mi></mrow><annotation
Q297: Determine whether or not the function
Q298: Graph the function with a graphing
Q299: For the given function, find the
Q301: The population of a small town
Q302: Graph the function with a graphing
Q303: Provide an appropriate response.<br>-If the ordered
Q304: Graph the equation.<br>- <span class="ql-formula" data-value="y
Q305: The function <span class="ql-formula" data-value="\mathrm