Multiple Choice
The following graph shows the populations of the metropolitan areas of City X and City Y over six years. 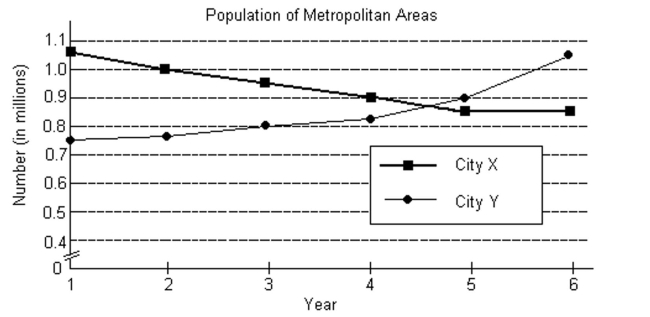
-If equations of the form y = f(t) were determined that modeled either of the two graphs, then the variable t would represent and the variable y would represent .
A) population (in millions) ; year
B) City X; City Y
C) City Y; City X
D) year; population (in millions)
Correct Answer:

Verified
Correct Answer:
Verified
Q467: Give all solutions of the nonlinear
Q468: Determine the inequality which matches the
Q469: Determine the system of inequalities illustrated
Q470: Provide an appropriate response.<br>-For a certain
Q471: Find the value of the determinant.<br>-
Q473: Use the given row transformation to
Q474: Use a graphing calculator to solve
Q475: Use a graphing calculator to solve
Q476: Solve the system by elimination.<br>- <span
Q477: If the system has infinitely many