Multiple Choice
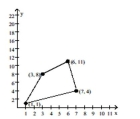
The graph shows the region of feasible solutions. Find the maximum or minimum value, as specified, of the objective
function.
- 
A) 112
B) 102
C) 120
D) 76
Correct Answer:

Verified
Correct Answer:
Verified
Related Questions
Q79: Find the indicated matrix.<br>-Let <span
Q80: Use the Gauss-Jordan method to solve
Q81: Which method should be used to
Q82: 20Solve the system using a graphing
Q83: Use a graphing calcula tor to
Q85: Solve the system for x and
Q86: Use a graphing calculator to Express
Q87: Graph the solution set of the
Q88: Find the cofactor of the indicated
Q89: Which method should be used to