Multiple Choice
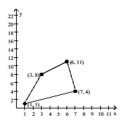
The graph shows the region of feasible solutions. Find the maximum or minimum value, as specified, of the objective
function.
- 
A) -5
B) -21
C) -39
D) -27
Correct Answer:

Verified
Correct Answer:
Verified
Related Questions
Q54: Find the values of the variables
Q55: Solve the problem.<br>-The perimeter of a
Q56: Use the Gauss-Jordan method to solve
Q57: Use a graphing calculator and the method
Q58: Use Cramer's rule to solve the
Q60: Solve the equation for x.<br>- <span
Q61: Provide an appropriate response.<br>-For any augmented matrix
Q62: Solve the system by elimination.<br>- <span
Q63: Find the dimension of the matrix.<br>-
Q64: Evaluate the determinant.<br>- <span class="ql-formula" data-value="\left|