Multiple Choice
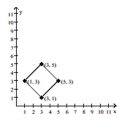
The graph shows the region of feasible solutions. Find the maximum or minimum value, as specified, of the objective
function.
- 
A) 27
B) 13
C) 100
D) 29
Correct Answer:

Verified
Correct Answer:
Verified
Related Questions
Q125: Use the Gauss-Jordan method to solve
Q126: Solve the problem using matrices.<br>-John has
Q127: Give all solutions of the nonlinear
Q128: Which method should be used to
Q129: Find the inverse, if it exists,
Q131: Use a graphing calculator to solve
Q132: Find the partial fraction decomposition for
Q133: Provide an appropriate response.<br>-Fill in the blanks
Q134: Use Cramer's rule to solve the
Q135: Solve the system by substitution.<br>- <span