Multiple Choice
The graph shows the region of feasible solutions. Find the maximum or minimum value, as specified, of the objective
function.
- 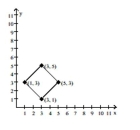
A) 18
B) 30
C) 14
D) 0
Correct Answer:

Verified
Correct Answer:
Verified
Related Questions
Q243: Graph the solution set of the
Q244: Solve the problem.<br>-The following table shows
Q245: Find the partial fraction decomposition for
Q246: Provide an appropriate response.<br>-For a certain
Q247: Determine the system of inequalities illustrated
Q249: Decide whether or not the matrices
Q250: Find the indicated matrix.<br>-Let <span
Q251: Which method should be used to
Q252: Solve the problem.<br>-The following table shows
Q253: Graph the solution set of the