Multiple Choice
The line graph shows the recorded hourly temperatures in degrees Fahrenheit at an airport. 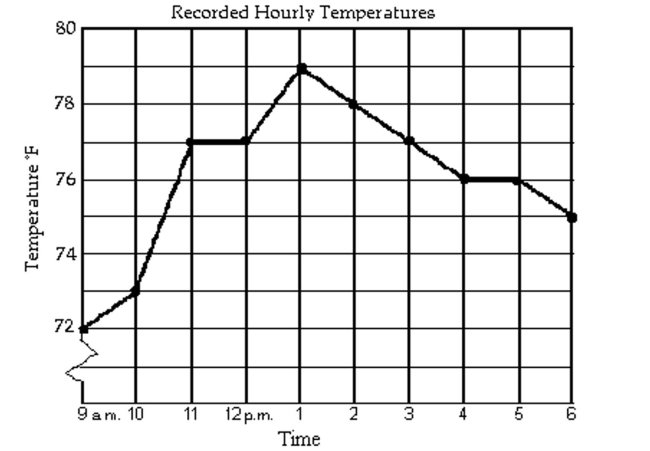
-What temperature was recorded at 4 p.m.?
A) 74 ° F
B) 77 ° F
C) 78 ° F
D) 76 ° F
Correct Answer:

Verified
Correct Answer:
Verified
Q331: Find the coordinates of the other endpoint
Q332: Provide an appropriate response.<br>-If a horizontal line
Q333: Choose the value which could represent the
Q334: For the points P and Q,
Q335: Graph the circle.<br>- <span class="ql-formula" data-value="(
Q337: Graph the function.<br>-<img src="https://d2lvgg3v3hfg70.cloudfront.net/TB7514/.jpg" alt="Graph the function.
Q338: The figure below shows the graph
Q339: Match the equation with the correct
Q340: Rewrite the equation so that one
Q341: Graph the function.<br>- <span class="ql-formula" data-value="g