Multiple Choice
The line graph shows the recorded hourly temperatures in degrees Fahrenheit at an airport. 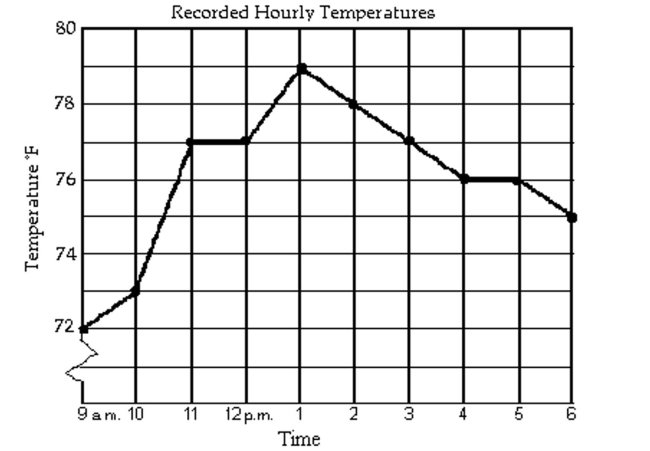
-During which two hour period did the temperature increase the most?
A) 10 a.m. to 11 a.m.
B) 10 a.m. to 12 p.m.
C) 12 p.m. to 2 p.m.
D) 9 a.m. to 11 a.m.
Correct Answer:

Verified
Correct Answer:
Verified
Related Questions
Q321: Decide whether or not the equation
Q322: Give the domain and range of
Q323: For the points P and Q,
Q324: Determine whether the three points are collinear.<br>-(5,
Q325: Decide whether the relation defines a
Q327: Match the description with the correct symbolic
Q328: Determine whether (f g)(x) =
Q329: The graph of y = f(x) is
Q330: Find the center and radius of
Q331: Find the coordinates of the other endpoint