Multiple Choice
Find the average rate of change illustrated in the graph.
-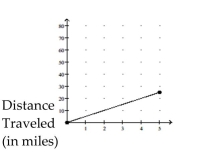 Time (in hours)
A) miles per hour
B) miles per hour
C) 5 miles per hour
D) 25 miles per hour
Correct Answer:

Verified
Correct Answer:
Verified
Related Questions
Q388: Write all linear equations in slope-intercept
Q389: Find the requested value.<br>- <span class="ql-formula"
Q390: For the points P and Q,
Q391: Compute and simplify the difference quotient
Q392: Find the center and radius of
Q394: Evaluate the function.<br>-Find <span class="ql-formula"
Q395: Match the description with the correct symbolic
Q396: Graph the line and give the
Q397: Suppose the point (2, 4) is
Q398: For the pair of functions, find