Multiple Choice
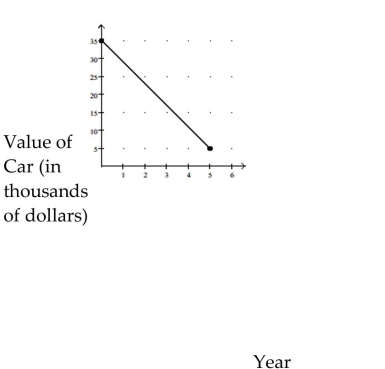
Find the average rate of change illustrated in the graph.
-
A) per year
B) per year
C) per year
D) per year
Correct Answer:

Verified
Correct Answer:
Verified
Related Questions
Q453: Find the slope of the line
Q454: Refer to the following graphs to
Q455: Write an equation for the line
Q456: Find the requested value.<br>-Using the given
Q457: Evaluate the function.<br>-Find <span class="ql-formula"
Q459: Find the requested value.<br>-Using the given
Q460: For the given functions f and
Q461: Choose the value which could represent the
Q462: Describe how the graph of the
Q463: A new chocolate company is estimating