Multiple Choice
Find the average rate of change illustrated in the graph.
-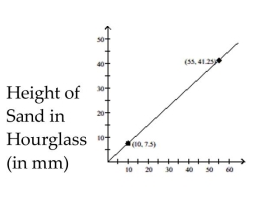
Time (in seconds)
A) per second
B) per second
C) per second
D) per second
Correct Answer:

Verified
Correct Answer:
Verified
Related Questions
Q37: The graph of a linear function
Q38: Graph the circle.<br>- <span class="ql-formula" data-value="x
Q39: Graph the function.<br>-Employees of a publishing company
Q40: Find the center-radius form of the
Q41: Write an equation for the line
Q43: Write an equation for the line described.
Q44: For the points P and Q,
Q45: Decide whether the relation defines a function.<br>-{(-4,
Q46: Determine whether the three points are collinear.<br>-(9,
Q47: Decide whether the relation defines a