Multiple Choice
Find the average rate of change illustrated in the graph.
-A school has just purchased new computer equipment for $16,000.00. The graph shows the 259) depreciation of the equipment over 5 years. The point (0, 16,000) represents the purchase price and
The point (5, 0) represents when the equipment will be replaced. Find and interpret the average rate
Of change in cost per year. 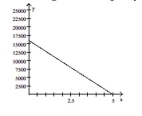
A) $3200 per year; the value of the equipment increases by $3200 per year during these years.
B) - $3200 per year; the value of the equipment decreases by $3200 per year during these years.
C) -$16,000 per year; the value of the equipment decreases by $16,000 per year during these years.
D) -$9600 per year; the value of the equipment decreases by $9600 per year during these years.
Correct Answer:

Verified
Correct Answer:
Verified
Q181: Determine whether (f g)(x) =
Q182: Find the specified domain.<br>-Find the domain
Q183: The figure below shows the graph
Q184: Graph the line and give the
Q185: Find the center-radius form of the
Q187: Graph the line and give the
Q188: Consider the function h as defined.
Q189: The graph of y = f(x) is
Q190: Give the domain and range of
Q191: Determine the largest open intervals of