Multiple Choice
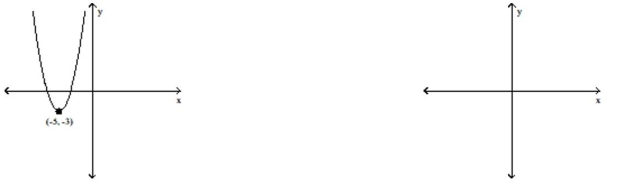
The figure below shows the graph of a function y = f(x) . Use this graph to
- 
A) 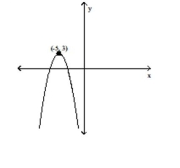
B) 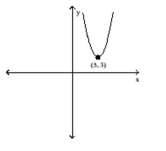
C) 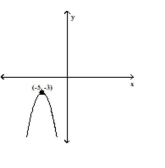
D) 
Correct Answer:

Verified
Correct Answer:
Verified
Related Questions
Q175: For the given functions f and
Q176: Find the specified domain.<br>-Find the domain
Q177: Determine the intervals of the domain
Q178: Find the center-radius form of the
Q179: Refer to the following graphs to
Q181: Determine whether (f g)(x) =
Q182: Find the specified domain.<br>-Find the domain
Q183: The figure below shows the graph
Q184: Graph the line and give the
Q185: Find the center-radius form of the