Multiple Choice
Data has been collected and a normal probability plot for one of the variables is shown below. Based on your knowledge of normal probability plots, do you believe the variable in question is normally distributed? The data are represented by the"o" symbols in the plot. 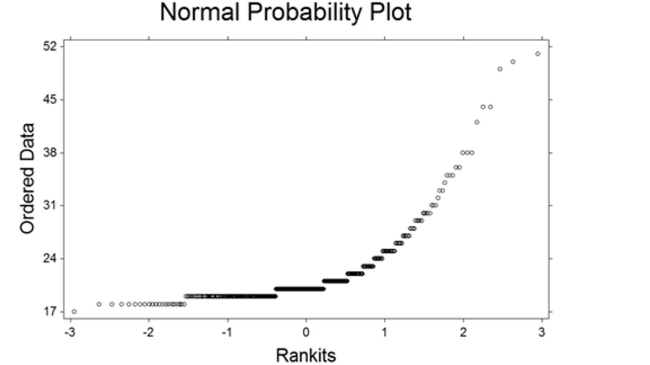
A) Yes. The plot reveals a straight line and this indicates the variable is normally distributed.
B) Yes. The plot reveals a curve and this indicates the variable is normally distributed.
C) No. The plot does not reveal a straight line and this indicates the variable is not normally distributed.
Correct Answer:

Verified
Correct Answer:
Verified
Q8: High temperatures in a certain city for
Q18: Which of the following is not
Q20: Suppose the candidate pool for two appointed
Q21: A discrete random variable x can
Q22: A dice game involves rolling three
Q24: The volume of soda a dispensing machine
Q25: Given that <span class="ql-formula" data-value="x"><span
Q26: The age of customers at a local
Q27: Which binomial probability is represented on the
Q28: <span class="ql-formula" data-value="\text { Find a value