Multiple Choice
260 randomly sampled college students were asked, among other things, to state their year in school (freshman, sophomore, junior, or senior) . The responses are shown in the bar graph below.
How many of the students who responded would be classified as upperclassmen (e.g., juniors or seniors) ? 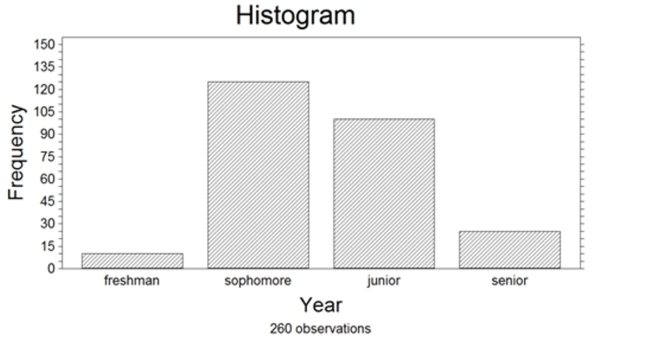
A) Approximately 100
B) Approximately 10
C) Approximately 25
D) Approximately 125
Correct Answer:

Verified
Correct Answer:
Verified
Q16: The bars in a bar graph can
Q109: The z-score uses the quartiles to identify
Q127: A recent survey was conducted to compare
Q129: A radio station claims that the amount
Q130: <img src="https://d2lvgg3v3hfg70.cloudfront.net/TB2969/.jpg" alt=" The
Q131: Many firms use on-the-job training to teach
Q133: The distribution of salaries of professional basketball
Q134: If nothing is known about the shape
Q136: Given a data set, which of the
Q137: Calculate the mean of a sample