Multiple Choice
The box plot shown below was constructed for the amount of soda that was poured by a filling machine into 12-ounce soda cans at a local soda bottling company. 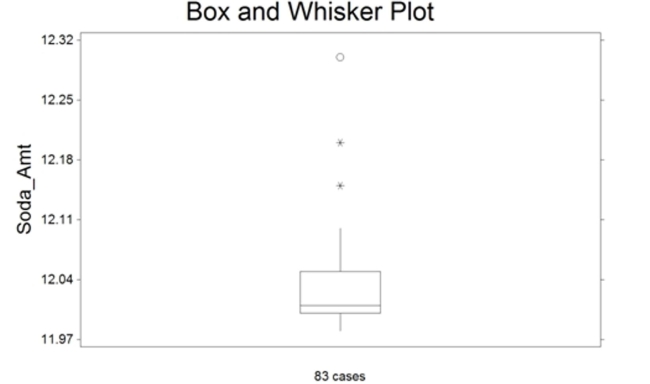
We see that one soda can received 12.15 ounces of soda on the plot above. Based on the box plot presented, how would you classify this observation?
A) it has a lot of soda
B) suspect outlier
C) highly suspect outlier
D) expected observation
Correct Answer:

Verified
Correct Answer:
Verified
Q39: For a given data set, which is
Q145: A larger standard deviation means greater variability
Q165: A small computing center has found that
Q167: Fill in the blank. One advantage of
Q168: A study was designed to investigate the
Q169: The following is a list of
Q169: Explain how using a scale break on
Q171: At the U.S. Open Tennis Championship a
Q172: The scores for a statistics test
Q173: Which of the following is a measure