Multiple Choice
One of the questions posed to a sample of 286 incoming freshmen at a large public university was, "Do you have any tattoos?" Their responses are shown below in the pie chart. Please note that the values shown represent the number of responses in each category. 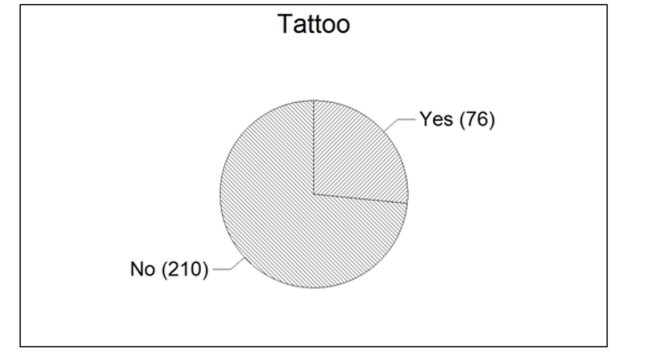 Based on the responses shown in the pie chart, what percentage of the freshmen responded with
"Yes?"
A) 76
B) 26.6%
C) 76%
D) 73.4%
Correct Answer:

Verified
Correct Answer:
Verified
Q6: Explain how stretching the vertical axis of
Q9: The slices of a pie chart must
Q53: Calculate the standard deviation of a
Q54: On a given day, the price of
Q55: A survey was conducted to determine
Q56: What is a time series plot?
Q57: What number is missing from the
Q59: The amount spent on textbooks for the
Q61: At the U.S. Open Tennis Championship a
Q62: A study was designed to investigate the