Multiple Choice
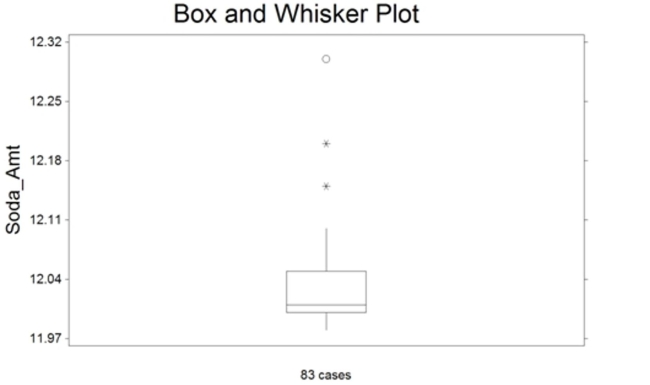
The box plot shown below was constructed for the amount of soda that was poured by a filling machine into 12-ounce soda cans at a local soda bottling company. 
We see that one soda can received 12.30 ounces of soda on the plot above. Based on the box plot
Presented, how would you classify this observation?
A) it has a lot of soda
B) highly suspect outlier
C) expected observation
D) suspect outlier
Correct Answer:

Verified
Correct Answer:
Verified
Q35: Explain how it can be misleading to
Q50: In general, the sample mean is a
Q61: The mean and the median are useful
Q62: A histogram can be constructed using either
Q68: Which of the following statements could be
Q80: Test scores for a history class had
Q81: The total points scored by a
Q83: At the U.S. Open Tennis Championship a
Q87: At the U.S. Open Tennis Championship a
Q88: Compute s<sup>2</sup> and s for the