Multiple Choice
A dot plot of the speeds of a sample of 50 cars passing a policeman with a radar gun is shown below. 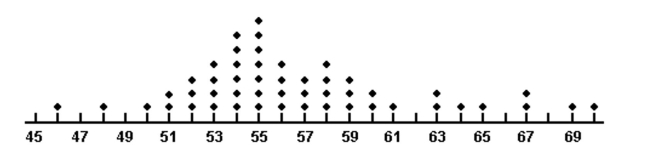
What proportion of the motorists were driving above the posted speed limit of 55 miles per hour?
A) 0.64
B) 0.50
C) 0.14
D) 7
Correct Answer:

Verified
Correct Answer:
Verified
Related Questions
Q5: The calculator screens summarize a data set.
Q6: A study was designed to investigate the
Q7: Each year advertisers spend billions of
Q8: The scores of nine members of
Q9: Parking at a university has become a
Q11: A radio station claims that the
Q12: The output below displays the mean
Q14: Each year advertisers spend billions of
Q15: A shoe retailer keeps track of
Q21: All class intervals in a histogram have