True/False
The scatterplot below shows a negative relationship between two variables. 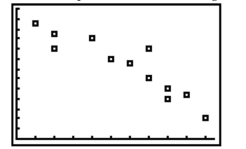
Correct Answer:

Verified
Correct Answer:
Verified
Related Questions
Q14: Each year advertisers spend billions of
Q15: A shoe retailer keeps track of
Q16: A sociologist recently conducted a survey
Q17: What is the primary advantage of a
Q20: The amount of time workers spend commuting
Q21: All class intervals in a histogram have
Q22: The scores for a statistics test
Q23: <span class="ql-formula" data-value="\text { Compute } s
Q116: In a symmetric and mound shaped distribution,
Q166: The range is an insensitive measure of