Multiple Choice
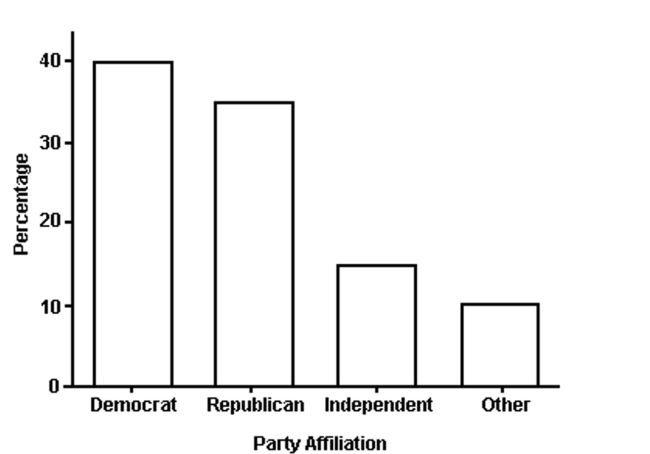 The bar graph shows the political affiliation of 1000 registered U.S. voters. What percentage of the voters belonged to one of the traditional two parties (Democratic or Republican) ?
A) 25%
B) 75%
C) 35%
D) 40%
Correct Answer:

Verified
Correct Answer:
Verified
Related Questions
Q66: A retail storeʹs customer satisfaction rating is
Q86: Given the sample variance of a distribution,
Q165: In a summary of recent real estate
Q179: The data show the total number
Q180: The temperature fluctuated between a low of
Q181: In a distribution that is skewed
Q182: A sociologist recently conducted a survey
Q183: The amount spent on textbooks for the
Q184: The calculator screens summarize a data set.
Q188: The output below displays the mean