Multiple Choice
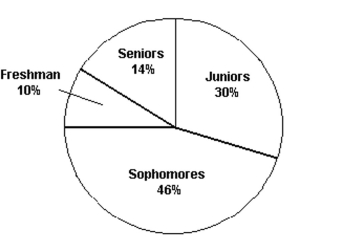
The pie chart shows the classifications of students in a statistics class. What percentage of the class consists of freshman, sophomores, and juniors?
A) 44%
B) 14%
C) 86%
D) 54%
Correct Answer:

Verified
Correct Answer:
Verified
Related Questions
Q24: The bars in a histogram should be
Q29: Chebyshevʹs rule applies to qualitative data sets,
Q39: For a given data set, which is
Q108: If a sample has mean 0 and
Q158: The amount of television viewed by today's
Q158: Either vertical or horizontal bars can be
Q162: A standardized test has a mean
Q164: Your teacher announces that the scores on
Q164: At the U.S. Open Tennis Championship a
Q165: A small computing center has found that