Multiple Choice
The box plot shown below displays the amount of soda that was poured by a filling machine into 12-ounce soda cans at a local bottling company. 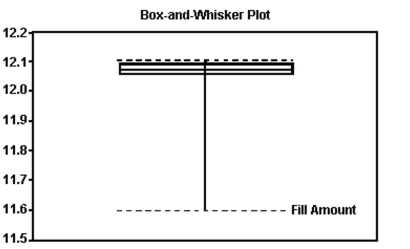
Based on the box plot, what shape do you believe the distribution of the data to have?
A) skewed to the right
B) approximately symmetric
C) skewed to the left
D) skewed to the center
Correct Answer:

Verified
Correct Answer:
Verified
Q45: A recent survey was conducted to compare
Q47: By law, a box of cereal labeled
Q48: Which of the graphical techniques below can
Q49: Which of the following statements concerning the
Q52: In an eye color study, 25 out
Q53: Calculate the standard deviation of a
Q54: On a given day, the price of
Q55: A survey was conducted to determine
Q100: Which measures variability about the mean, the
Q106: If a z-score is 0 or near