Essay
Does the following control chart represent a process that is in control or out of control? If it is out of control, explain how you arrived at this conclusion. 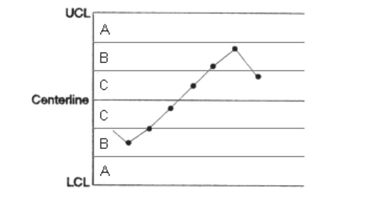
Correct Answer:

Verified
out of control; six ...View Answer
Unlock this answer now
Get Access to more Verified Answers free of charge
Correct Answer:
Verified
out of control; six ...
View Answer
Unlock this answer now
Get Access to more Verified Answers free of charge
Related Questions
Q4: The process of monitoring and eliminating variation
Q5: Special causes of variation can often be
Q6: (Situation B) A manufacturing company makes
Q7: The table below shows the data
Q8: The p-chart is typically used to monitor
Q10: An unbiased estimator for ? can
Q11: The p-chart is based on the assumption
Q12: (Situation C) Ten samples of
Q13: If the R-chart indicates that the
Q14: Does the following control chart represent a