Short Answer
Does the following control chart represent a process that is in control or out of control? If it
is out of control, explain how you arrived at this conclusion. 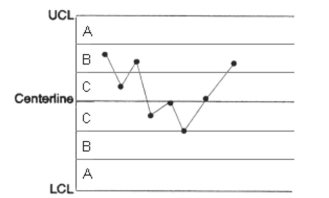
Correct Answer:

Verified
Correct Answer:
Verified
Related Questions
Q19: A process is in control and
Q20: The primary goal of quality-improvement activities is<br>A)
Q21: (Situation C) Ten samples of
Q22: The upper and lower control limits are
Q23: Estimate the process spread when s
Q25: <span class="ql-formula" data-value="\text { The } \bar
Q26: (Situation D) A walk-in freezer thermostat
Q27: (Situation B) A manufacturing company makes
Q28: A process may be in control but
Q29: (Situation F) Ten samples of