Essay
Does the following control chart represent a process that is in control or out of control? If it is out of control, explain how you arrived at this conclusion. 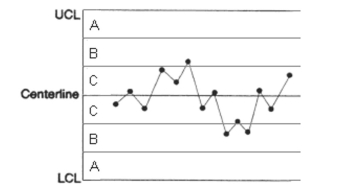
Correct Answer:

Verified
out of control; four...View Answer
Unlock this answer now
Get Access to more Verified Answers free of charge
Correct Answer:
Verified
out of control; four...
View Answer
Unlock this answer now
Get Access to more Verified Answers free of charge
Related Questions
Q45: People, machines, and raw materials can all
Q46: _ are boundary points that define the
Q47: A process adds value to the inputs
Q48: The table below shows the data
Q49: The distribution that describes the output variable
Q51: The centerline and control limits of a
Q52: If quality is designed into products and
Q53: The R-chart is used to detect changes
Q54: When using a cause-and-effect diagram in process
Q55: Estimate the process spread when s