Short Answer
Does the following control chart represent a process that is in control or out of control? If it is out of control, explain how you arrived at this conclusion. 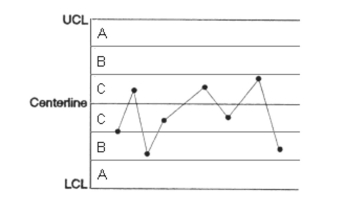
Correct Answer:

Verified
Correct Answer:
Verified
Related Questions
Q12: (Situation C) Ten samples of
Q13: If the R-chart indicates that the
Q14: Does the following control chart represent a
Q15: Find the process spread when
Q16: The diagnosis phase of statistical process control
Q18: A system receives inputs from its environment,
Q19: A process is in control and
Q20: The primary goal of quality-improvement activities is<br>A)
Q21: (Situation C) Ten samples of
Q22: The upper and lower control limits are