Short Answer
Does the following control chart represent a process that is in control or out of control? If it is out of control, explain how you arrived at this conclusion. 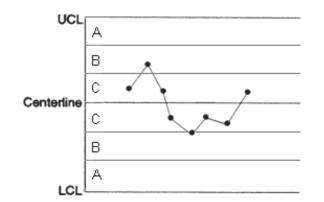
Correct Answer:

Verified
Correct Answer:
Verified
Related Questions
Q71: Control charts are the tool of choice
Q72: <span class="ql-formula" data-value="\text { Find the value
Q73: An in-control, centered process that follows
Q74: (Situation D) A walk-in freezer thermostat
Q75: (Situation B) A manufacturing company makes
Q77: (Situation E) A machine at K-Company
Q78: Find the specification spread when USL
Q79: Control limits and specification limits are essentially
Q80: <span class="ql-formula" data-value="\text { Find the value
Q81: Control charts are useful for evaluating the