Multiple Choice
Solve the problem.
-The data below represent the average monthly cost of natural gas in an Oregon home. 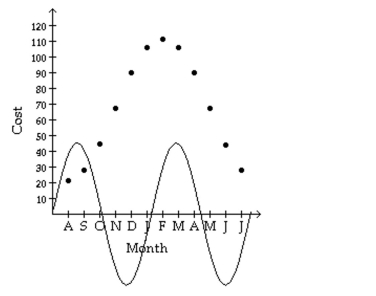 Above is the graph of superimposed over a scatter diagram of the data. Find the sinusoidal function o form which best fits the data.
A)
B)
C)
D)
Correct Answer:

Verified
Correct Answer:
Verified
Related Questions
Q93: Choose the one alternative that best
Q94: If A denotes the area of
Q95: Solve the problem.<br>-The Earth rotates about its
Q96: Find the exact value of the
Q97: Choose the one alternative that best
Q99: Graph the function. Show at least
Q100: Solve the problem.<br>-For a circle of
Q101: Convert the angle in radians to
Q102: Graph the function.<br>- <span class="ql-formula" data-value="y=2
Q103: Answer the question.<br>-Which one of the