Multiple Choice
Write the word or phrase that best completes each statement or answers the question.
-The following scatter diagram shows heights (in inches) of children and their ages. 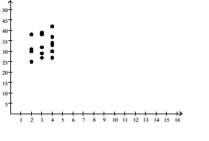
Age (years) What is the expected height range for a 2-year old child?
A) 40-50 inches
B) 35-45 inches
C) 25-38 inches
D) 20-30 inches
Correct Answer:

Verified
Correct Answer:
Verified
Q290: Determine the average rate of change for
Q291: Solve the equation.<br>- <span class="ql-formula" data-value="|
Q292: Find the zeros of the quadratic
Q293: Solve the problem.<br>-If <span class="ql-formula"
Q294: Graph the function f by starting
Q296: employees each year.<br>Choose the one alternative
Q297: Solve the problem.<br>-Let <span class="ql-formula"
Q298: Use the slope and y-intercept to
Q299: Graph the function using its vertex,
Q300: Find the vertex and axis of