Essay
Solve the problem.
-The following data represents the normal monthly precipitation for a certain city.
\begin{tabular} { l | c } 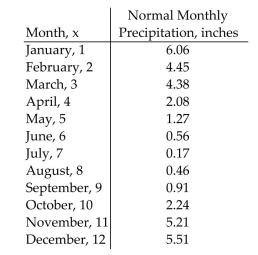
Draw a scatter diagram of the data for one period. Find a sinusoidal function of the form that fits the data. Draw the sinusoidal function on the scatter diagram. Use a graphing utility to find the sinusoidal function of best fit. Draw the sinusoidal function of best fit on the scatter diagram.
Correct Answer:

Verified
Correct Answer:
Verified
Q196: Find the reference angle for the
Q197: Determine the phase shift of the
Q198: Graph the function and y =
Q199: Graph the function.<br>- <span class="ql-formula" data-value="y=-\left|2
Q200: Find the exact value of the
Q202: Find the exact value of the
Q203: Additional Concepts<br>- <span class="ql-formula" data-value="\csc x
Q204: Draw Angles in Standard Position<br>- <span
Q205: Additional Concepts<br>-<img src="https://d2lvgg3v3hfg70.cloudfront.net/TB7044/.jpg" alt="Additional Concepts -
Q206: Convert the angle in degrees to