Essay
Solve the problem.
-The following data represents the normal monthly precipitation for a certain city.
\begin{tabular} { l | c } 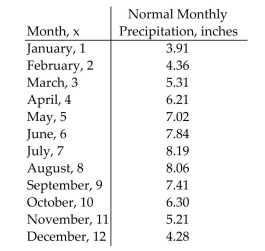
Draw a scatter diagram of the data for one period. Find the sinusoidal function of the form that fits the data. Draw the sinusoidal function on the scatter diagram. Use a graphing utility to find the sinusoidal function of best fit. Draw the sinusoidal function of best fit on the scatter diagram.
Correct Answer:

Verified
Correct Answer:
Verified
Q113: Determine the amplitude or period as
Q114: Use a calculator to find the
Q115: Solve Problems Involving Bearings<br>-Find the bearing
Q116: Find a cofunction with the same
Q117: Find the length of the arc on
Q119: The point P(x, y) on the
Q120: Convert the angle in radians to
Q121: Graph the function.<br>- <span class="ql-formula" data-value="y=-3
Q122: Find the length of the arc
Q123: Use even and odd properties of