Multiple Choice
Use the Leading Coefficient Test to determine the end behavior of the polynomial function. Then use this end
-The following table shows the number of DWI arrests in a county for the years , where 1 represents 1994, 2 represents 1995, and so on.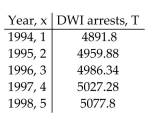
This data can be approximated using the third-degree polynomial
Use the Leading Coefficient Test to determine the end behavior to the right for the graph of T. Will this function be useful in modeling the number of DWI arrests over an extended period of time? Explain your answer.
A) The graph of T decreases without bound to the right. This means that as increases, the values of will become more and more negative and the function will no longer model the number of DWI arrests.
B) The graph of increases without bound to the right. This means that as increases, the values of will become large and positive and, since the values of T will become so large, the function will no longer model the number of DWI arrests.
C) The graph of approaches zero for large values of . This means that will not be useful in modeling the number of DWI arrests over an extended period.
D) The graph of T decreases without bound to the right. Since the number of larceny thefts will eventually decrease, the function T will be useful in modeling the number of DWI arrests over an extended period of time.
Correct Answer:

Verified
Correct Answer:
Verified
Q2: Find the zeros for the polynomial
Q3: Divide using long division.<br>-Two people are
Q4: x Find the range of the
Q5: Use the graph or table to
Q6: Find the coordinates of the vertex
Q8: Determine the constant of variation for
Q9: Find the y-intercept of the polynomial
Q10: Find the x-intercepts of the polynomial
Q11: Solve the polynomial equation. In order
Q12: Find the horizontal asymptote, if any,