Multiple Choice
Determine the maximum possible number of turning points for the graph of the function.
-Suppose that a polynomial function is used to model the data shown in the graph below. For what intervals is the function increasing?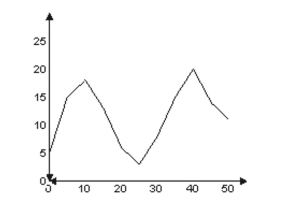
A) 0 through 10 and 25 through 40
B) 0 through 40
C) 0 through 10 and 20 through 50
D) 10 through 25 and 40 through 50
Correct Answer:

Verified
Correct Answer:
Verified
Q347: Solve the polynomial inequality and graph
Q348: Graph the rational function.<br>- <span class="ql-formula"
Q349: Find the domain of the rational
Q350: Choose the one alternative that best
Q351: Use the Leading Coefficient Test to
Q353: Solve the problem.<br>-In one U.S. city,
Q354: Choose the one alternative that best
Q355: Find an nth degree polynomial function
Q356: Solve the problem.<br>-The owner of a
Q357: Determine whether the graph shown is the