Multiple Choice
Determine the maximum possible number of turning points for the graph of the function.
-Suppose that a polynomial function is used to model the data shown in the graph below. 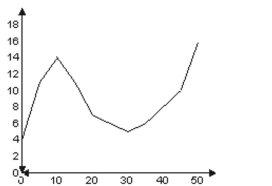
For what intervals is the function increasing?
A) 0 through 10 and 30 through 50
B) 0 through 50
C) 0 through 20 and 30 through 50
D) 0 through 10 and 40 through 50
Correct Answer:

Verified
Correct Answer:
Verified
Q170: Find the zeros of the polynomial
Q171: Solve the problem.<br>-A ball is thrown
Q172: Divide using synthetic division.<br>- <span class="ql-formula"
Q173: Solve the polynomial inequality and graph
Q174: Choose the one alternative that best
Q176: Solve Problems Involving Joint Variation<br>- <span
Q177: Find the zeros of the polynomial
Q178: Find the x-intercepts (if any) for
Q179: The graph of a quadratic function
Q180: Find the zeros for the polynomial