Multiple Choice
Determine the maximum possible number of turning points for the graph of the function.
-Suppose that a polynomial function is used to model the data shown in the graph below. 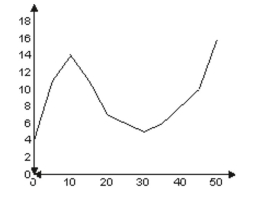
For what intervals is the function decreasing?
A) 10 through 30
B) 0 through 30
C) 10 through 20 and 30 through 50
D) 0 through 10 and 30 through 50
Correct Answer:

Verified
Correct Answer:
Verified
Q217: Find the slant asymptote, if any,
Q218: Find the y-intercept of the polynomial
Q219: Use the Leading Coefficient Test to
Q220: Choose the one alternative that best
Q221: Find the indicated intercept(s) of the
Q223: Solve Problems Involving Joint Variation<br>- <span
Q224: Find the vertical asymptotes, if any,
Q225: Solve Problems Involving Joint Variation<br>- <span
Q226: Determine the maximum possible number of
Q227: Find the coordinates of the vertex