Multiple Choice
Determine the maximum possible number of turning points for the graph of the function.
-Suppose that a polynomial function is used to model the data shown in the graph below. 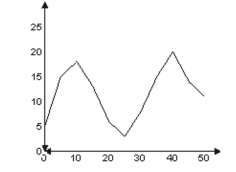
Determine the degree of the polynomial function of best fit and the sign of the leading coefficient.
A) Degree 4; negative leading coefficient.
B) Degree 5; positive leading coefficient.
C) Degree 5; negative leading coefficient.
D) Degree 4; positive leading coefficient.
Correct Answer:

Verified
Correct Answer:
Verified
Q359: x Find the range of the
Q360: Determine whether the graph shown is the
Q361: Find the x-intercepts of the polynomial
Q362: Determine whether the graph shown is the
Q363: Find the y-intercept for the graph
Q365: Choose the one alternative that best
Q366: Use synthetic division and the Remainder
Q367: Write an equation that expresses the relationship.
Q368: Solve Problems Involving Joint Variation<br>- <span
Q369: Use synthetic division to show that