Multiple Choice
The graph below shows the percentage of students enrolled in the College of Engineering at State University. Use
the graph to answer the question. 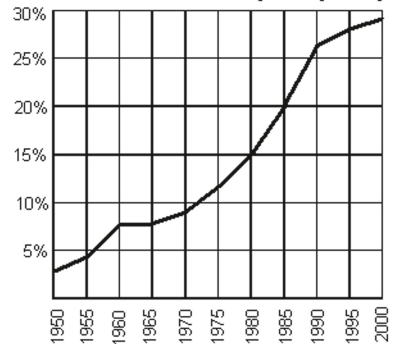
-If f(x) = 15%, what year is represented by x?
A) 1980
B) 1975
C) 1985
D) 1970
Correct Answer:

Verified
Correct Answer:
Verified
Related Questions
Q275: Graph the linear function by plotting
Q276: Solve.<br>-A vendor has learned that, by
Q277: Use the graph of the given
Q278: For the given functions f and
Q279: Find the slope of the line
Q281: Find an equation for the line
Q282: Find and simplify the difference quotient
Q283: Identify the intercepts.<br>-<img src="https://d2lvgg3v3hfg70.cloudfront.net/TB7044/.jpg" alt=" Identify
Q284: Given functions f and g, perform
Q285: Use the vertical line test to determine