Multiple Choice
The graph below shows the percentage of students enrolled in the College of Engineering at State University. Use
the graph to answer the question. 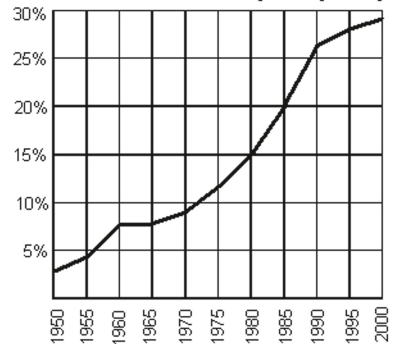
-Between what two years is the difference in function values equal to 5%?
A) between 1980 and 1985
B) between 1985 and 1990
C) between 1970 and 1975
D) between 1960 and 1965
Correct Answer:

Verified
Correct Answer:
Verified
Q25: Find the center and the radius
Q26: Given functions f and g, perform
Q27: Begin by graphing the standard absolute
Q28: Identify the intercepts.<br>-<img src="https://d2lvgg3v3hfg70.cloudfront.net/TB7044/.jpg" alt=" Identify
Q29: Determine the slope and the y-intercept
Q31: For the given functions f and
Q32: Identify the intercepts.<br>-<img src="https://d2lvgg3v3hfg70.cloudfront.net/TB7044/.jpg" alt=" Identify
Q33: Use the graph of f to draw
Q34: Given functions f and g, perform
Q35: Begin by graphing the standard cubic