Multiple Choice
Graph the linear function by plotting the x- and y-intercepts.
- 
A) intercepts: 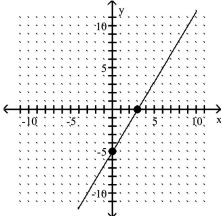
B) intercepts: 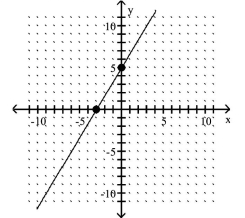
C) intercepts: 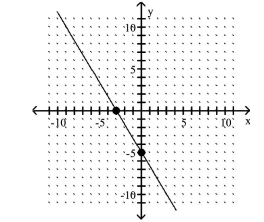
D) intercepts: 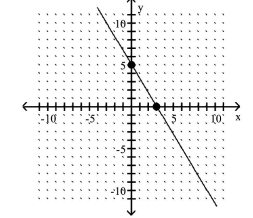
Correct Answer:

Verified
Correct Answer:
Verified
Related Questions
Q11: Begin by graphing the standard square
Q12: Does the graph represent a function that
Q13: Find the slope of the line
Q14: Solve.<br>-When making a telephone call using
Q15: Solve.<br>-When making a telephone call using
Q17: Find the inverse of the one-to-one
Q18: Complete the square and write the
Q19: Given functions f and g, perform
Q20: Find the domain of the function.<br>-
Q21: Determine whether the given function is