Multiple Choice
Given functions f and g, perform the indicated operations.
-The following graph shows the private, public and total national school enrollment for students for select years from 1970 through 2000 .
National School Enrollment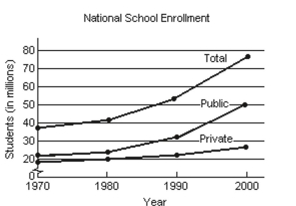
i) How is the graph for total school enrollment, T, determined from the graph of the private enrollment, , and the public enrollment, u?
ii) During which 10 -year period did the total number of students enrolled increase the least?
iii) During which 10 -year period did the total number of students enrolled increase the most?
A) i) is the sum of and .
ii)
iii)
B) i) is the sum of and
ii)
iii)
C) i) is the sum of and .
ii)
iii)
D) i) is the difference of and .
ii)
iii)
Correct Answer:

Verified
Correct Answer:
Verified
Q217: Use the vertical line test to determine
Q218: Solve.<br>-An investment is worth <span
Q219: Determine which two functions are inverses
Q220: Begin by graphing the standard quadratic
Q221: Evaluate the function at the given
Q223: Find the slope then describe what
Q224: Determine whether the equation defines y
Q225: Use the given conditions to write
Q226: Use the given conditions to write
Q227: Identify the Domain and Range of