Multiple Choice
In 2002 data were collected on the percent of people in the U.S. not covered by
Health insurance. Summary statistics and a histogram for these data are shown below.
What is the most appropriate measure to describe the center of these data? 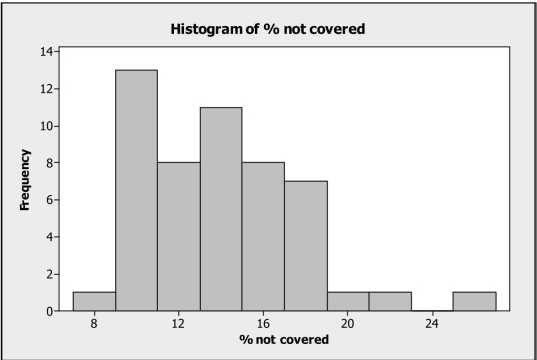
A) Range
B) Mean
C) Standard Deviation
D) Median
E) IQR
Correct Answer:

Verified
Correct Answer:
Verified
Q14: A magazine that publishes product reviews
Q15: An advocacy group is investigating whether
Q16: A magazine that publishes product reviews
Q17: The U.S. Bureau of Labor Statistics (BLS)
Q18: Boxplots of earnings per share (EPS) data
Q20: A researcher is conducting a study on
Q21: For families who live in apartments the
Q22: Below is a stem and leaf
Q23: A recent survey of online shoppers
Q24: A regression analysis of company profits