Multiple Choice
Analyze scatterplots and correlation coefficients.
-For the scatterplot shown below, the likely correlation coefficient is 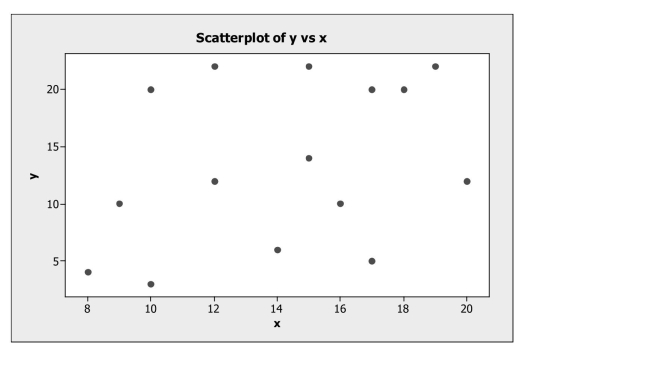
A) +0.35
B) +0.90
C) +0.77
D) -0.89
E) -1.00
Correct Answer:

Verified
Correct Answer:
Verified
Q14: Check conditions for correlation and linear regression.<br>-A
Q15: Interpret the value of correlation coefficients
Q16: Assign roles to variables.<br>-A study examined consumption
Q18: A consumer research group investigating the relationship
Q20: Analyze residuals.<br>-Linear regression was used to describe
Q21: Consider the following to answer the question(s)
Q21: Interpret the value of correlation coefficients
Q22: Write and interpret a linear regression
Q23: Interpret a linear regression equation and use
Q24: The following scatterplot shows monthly sales figures