Multiple Choice
Describe displays of distributions.
-Below is a histogram of salaries (in $) for a sample of U.S. marketing managers. The
Shape of this distribution is 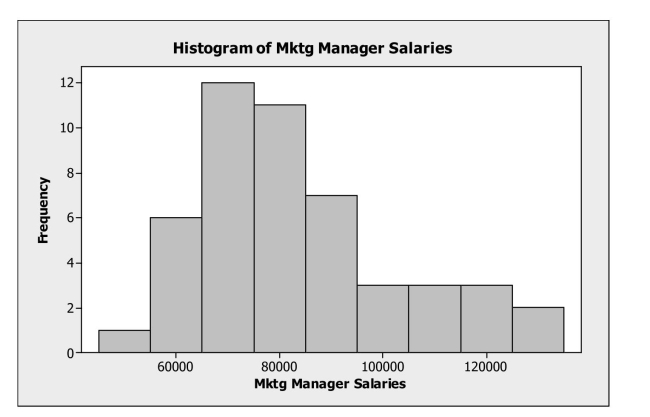
A) symmetric.
B) bimodal.
C) right skewed.
D) left skewed.
E) normal.
Correct Answer:

Verified
Correct Answer:
Verified
Q6: Interpret summary statistics.<br>-Consider the five number
Q7: Analyze data of quantitative variables.<br>-The following
Q8: Interpret summary statistics.<br>-Consider the five number
Q9: The following boxplots show monthly sales revenue
Q11: Interpret displays of distributions.<br>-The following boxplots show
Q12: Interpret displays of distributions.<br>-The following boxplots show
Q13: Interpret summary statistics.<br>-Consider the five number
Q14: The following table shows closing share
Q15: Following is the five number summary
Q19: The ASQ (American Society for Quality) regularly