Multiple Choice
Determine if a display of data is appropriate.
-The following bar chart summarizing consumer preferences for various brands of
Digital cameras shows 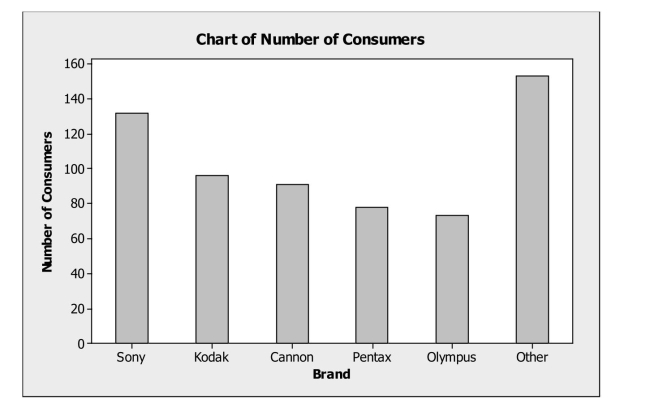
A) the marginal distribution of brands.
B) the conditional distribution of brands.
C) the contingency distribution of brands.
D) the distribution for a quantitative variable.
E) none of the above.
Correct Answer:

Verified
Correct Answer:
Verified
Q11: Examine a contingency table.<br>-A regional survey
Q12: Create and analyze relative frequency distributions.<br>-A
Q13: Find conditional and marginal distributions.<br>-A regional
Q14: Determine if a display of data is
Q15: Examine a contingency table.<br>-A large national
Q16: Find conditional and marginal distributions.<br>-A full
Q17: Create and analyze relative frequency distributions.<br>-A
Q18: Find conditional and marginal distributions.<br>-A large national
Q19: Find conditional and marginal distributions.<br>-A regional
Q21: Find conditional and marginal distributions.<br>-A regional