Multiple Choice
Determine when a linear model is appropriate for data.
-Monthly closing stock prices for a utility company were obtained from January 2007
Through August 2008. A regression model was estimated to describe the trend in closing
Stock prices over time. What does the plot of residuals below suggest? 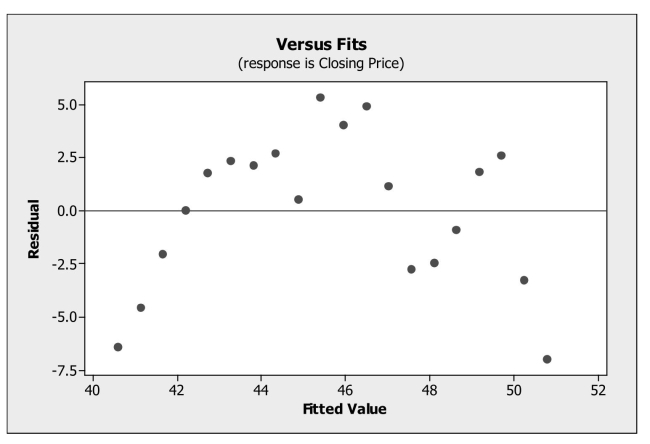
A) An outlier is present in the data set.
B) The linearity condition is not satisfied.
C) A high leverage point is present in the data set.
D) The data are not normal.
E) The equal spread condition is not satisfied.
Correct Answer:

Verified
Correct Answer:
Verified
Q11: Determine when a linear model is appropriate
Q12: Recognize unusual or extraordinary points.<br>-Suppose a regression
Q13: Examining residuals for groups.<br>-A medical researcher was
Q14: Monthly closing stock prices for a utility
Q15: Data on labor productivity and unit labor
Q17: Data on internet usage (per 100 inhabitants)
Q18: Recognize the presence of autocorrelation in residuals.<br>-Monthly
Q19: Perform statistical inference for multiple regression.<br>-The advertising
Q20: Understand how working with summary values affects
Q21: Quarterly sales figures for e-commerce retail sales