Multiple Choice
Determine when a linear model is appropriate for data.
-A linear regression model was estimated to describe the trend in world population over
Time. Below is the plot of residuals versus predicted values. What does the plot of
Residuals suggest? 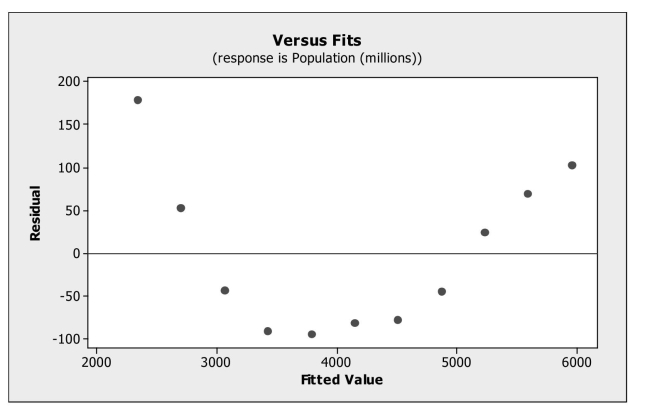
A) An outlier is present in the data set.
B) The linearity condition is not satisfied.
C) A high leverage point is present in the data set.
D) The data are not normal.
E) The equal spread condition is not satisfied.
Correct Answer:

Verified
Correct Answer:
Verified
Q5: Recognize the presence of autocorrelation in residuals.<br>-Quarterly
Q6: Determine when a linear model is appropriate
Q7: Recognize an extrapolation.<br>-Data on internet usage (per
Q8: Re-express data to make them appropriate for
Q9: Recognize an extrapolation.<br>-The advertising campaign for a
Q11: Determine when a linear model is appropriate
Q12: Recognize unusual or extraordinary points.<br>-Suppose a regression
Q13: Examining residuals for groups.<br>-A medical researcher was
Q14: Monthly closing stock prices for a utility
Q15: Data on labor productivity and unit labor